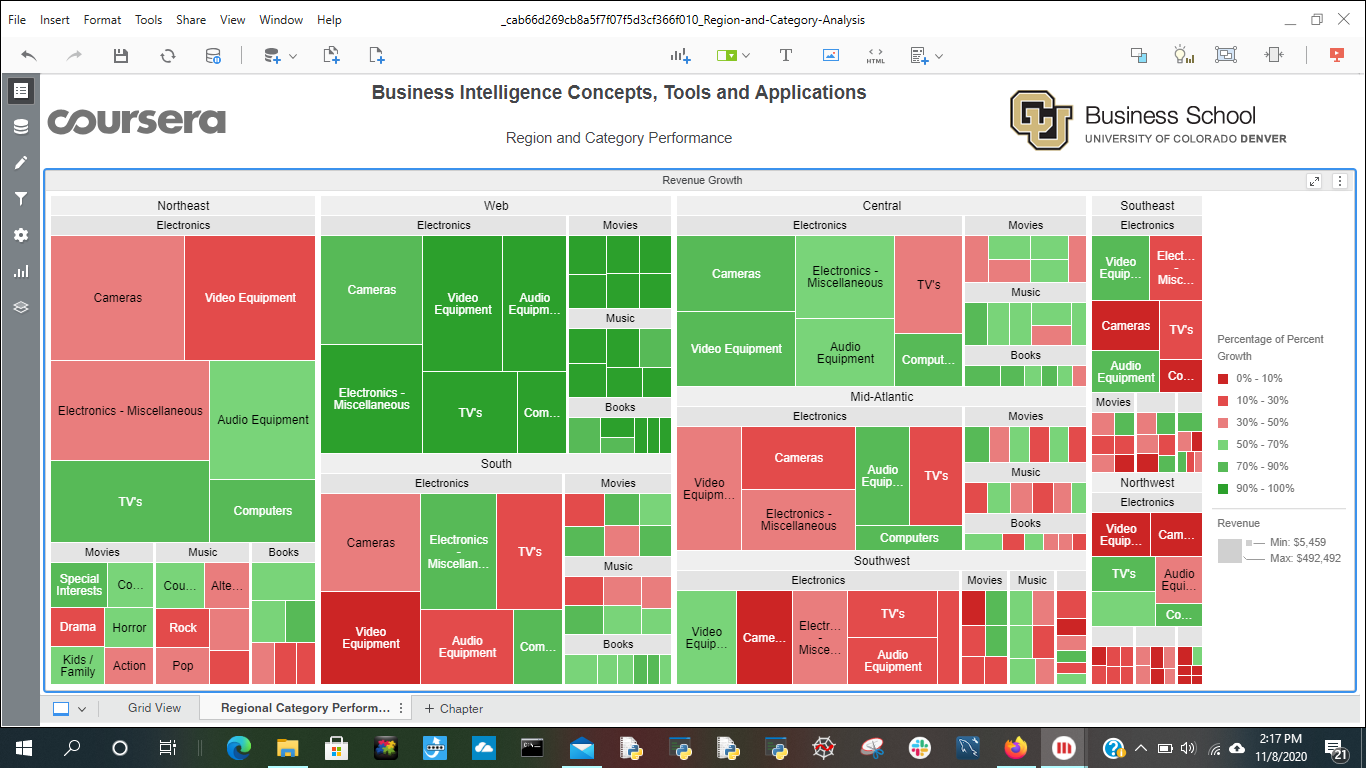
Below I demonstrate a basic analysis of the “Region and Category” Microstrategy template. Showcasing the Northeast Region, electronics category and subcategories; filtered on color by discount % of revenue.


Professional Business Services: Business Process Improvement, Bookkeeping, IT Solutions, Human Resources, Payroll, Wordpress.com Website, Data Analysis, and Management Consulting
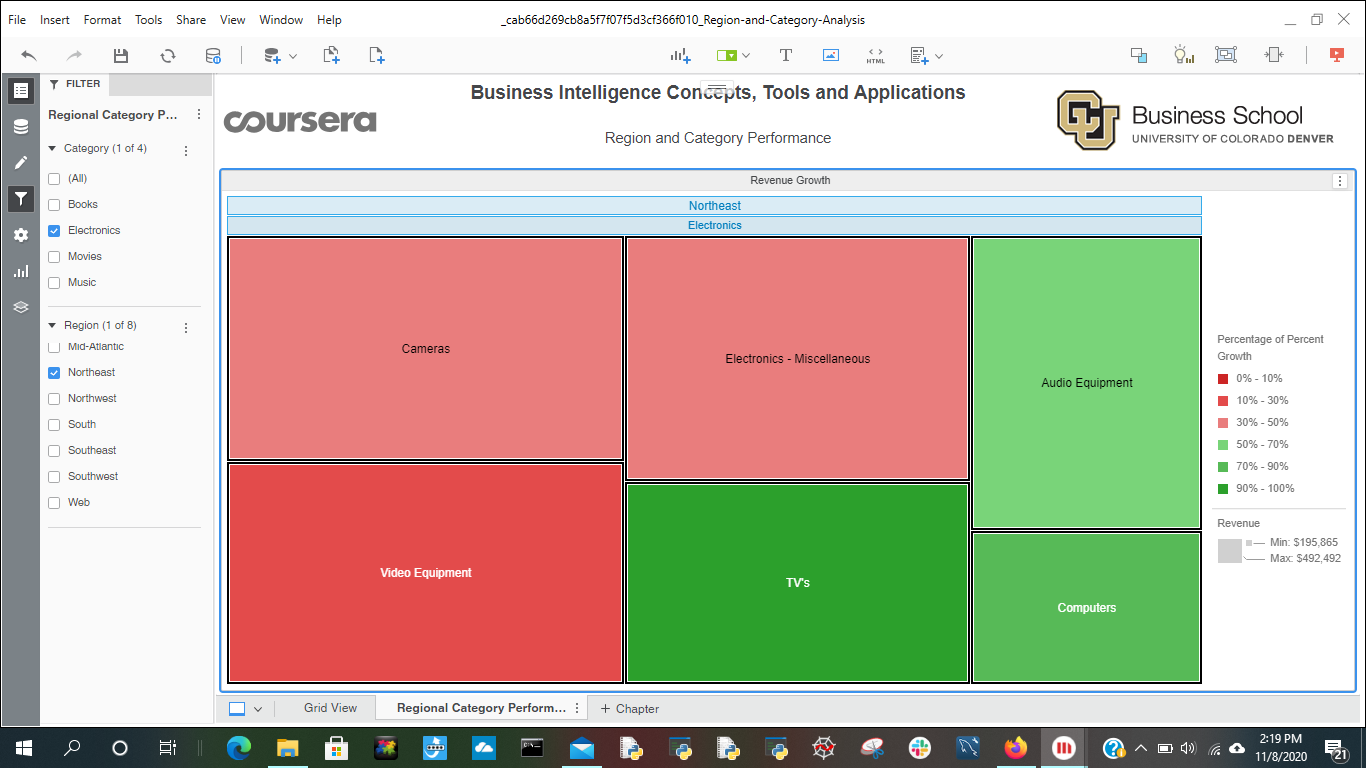
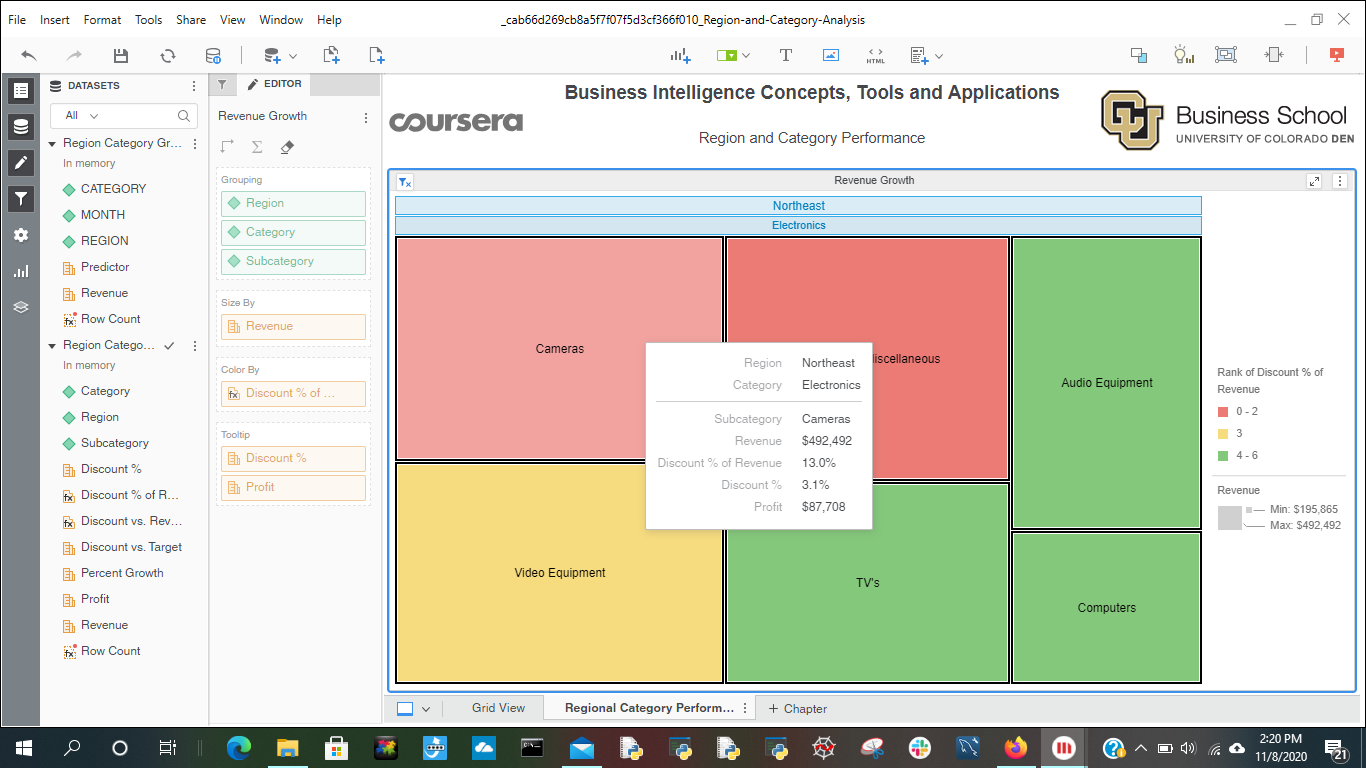
Below I demonstrate a basic analysis of the “Region and Category” Microstrategy template. Showcasing the Northeast Region, electronics category and subcategories; filtered on color by discount % of revenue.
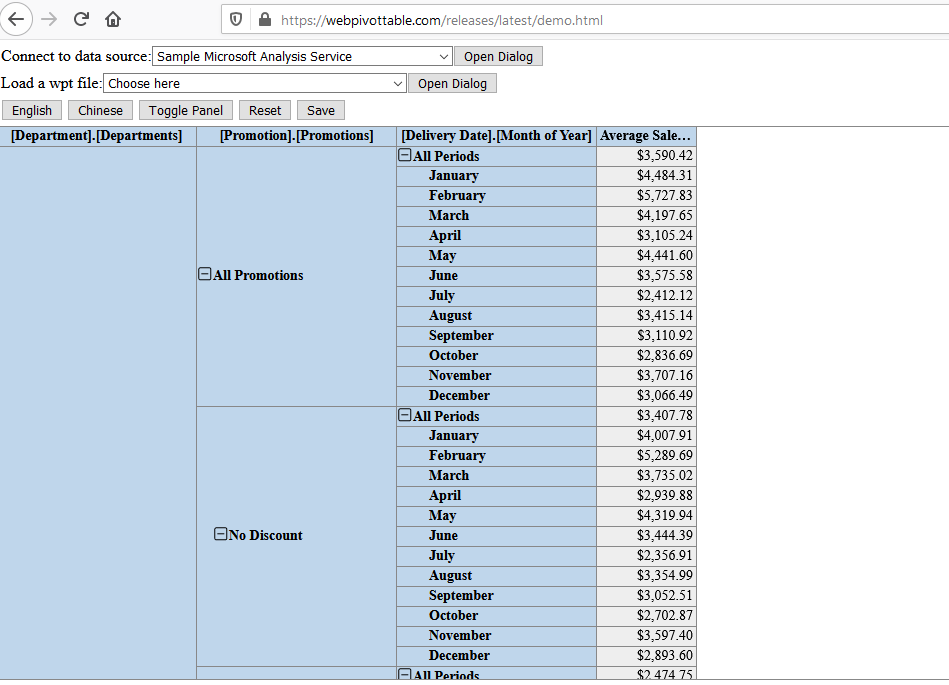
Here I demonstrate data analysis and knowledge of OLAP tool, WebPivotTable. See sample pivot table below:
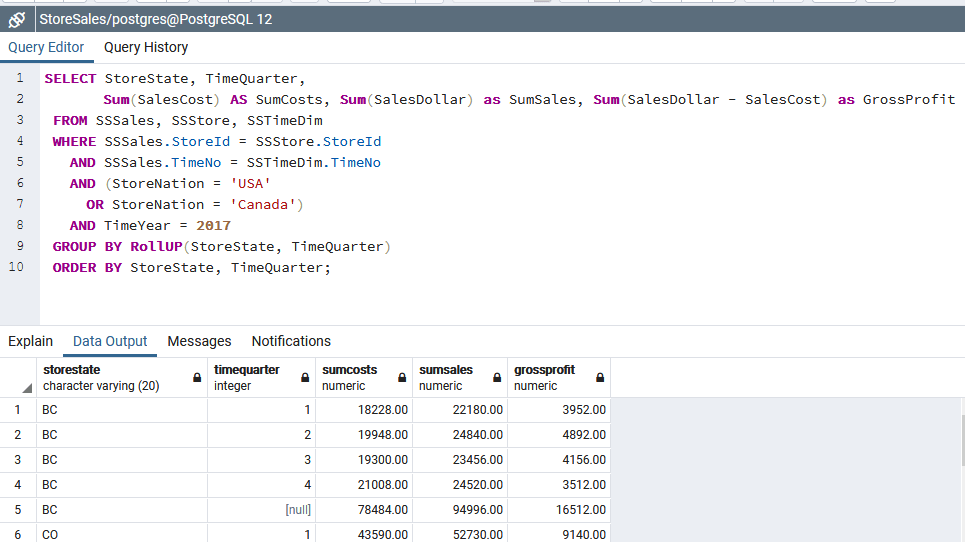
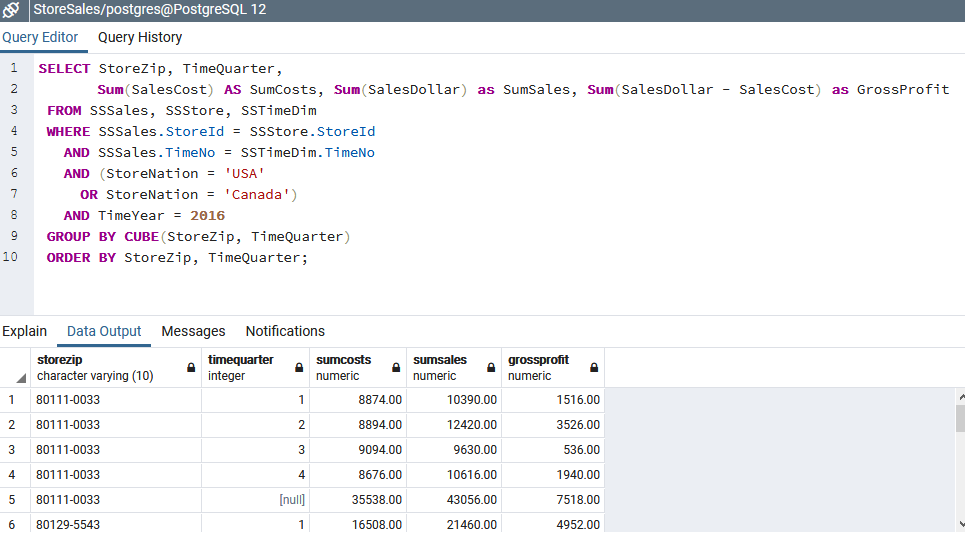
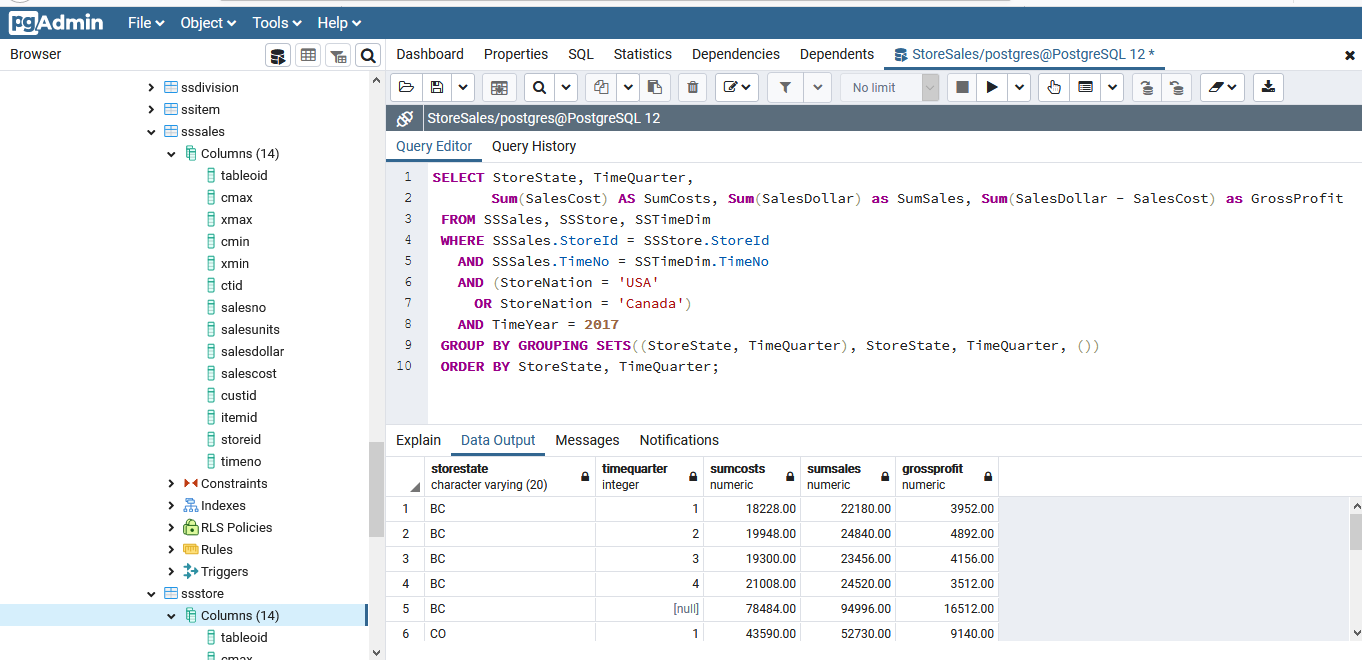
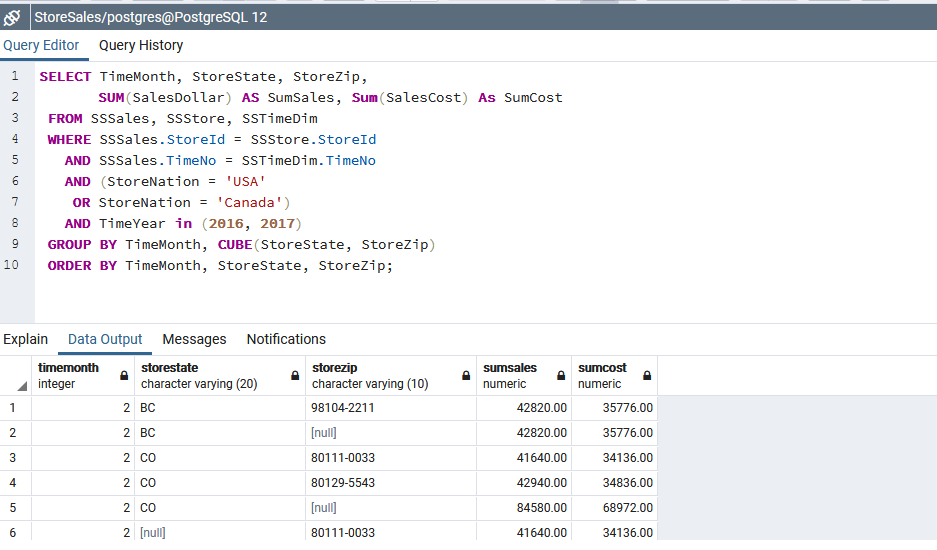
Continuing my SQL education, I have been working with PostgresSQL while taking online courses via Coursera. I have create some SQL statements using cube, rollup and grouping sets operators. See below:
Cube
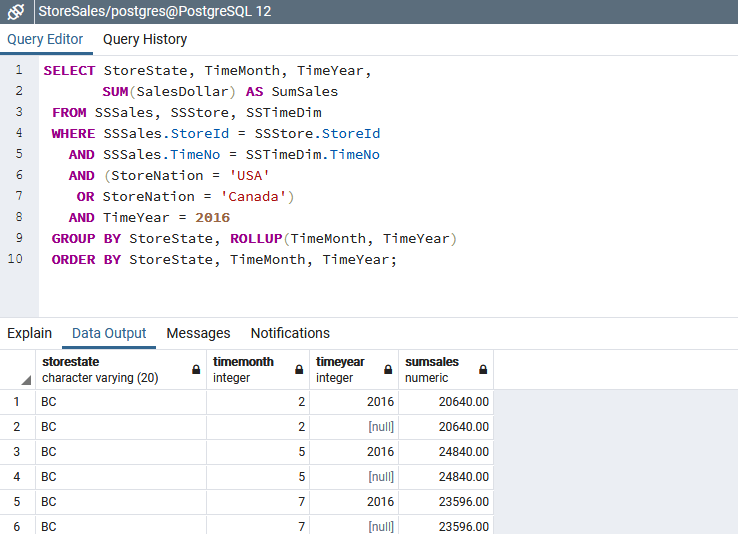
ROLLUP:

Grouping Sets:
Partial Cube:
Partial RollUP:
When you finish creating your Entity Relationship Diagram and made sure that there are no errors; you can then start converting to tables by using the conversion rules. See below.
Entity Type Rule: Convert the Student, Loan, Institution, Lender and DisburseLine entity types into tables.
1-M Relationships rule for all relationships except Sent relationship.
Use the M-N relationship to convert the Sent relationship.
Use the identification dependency rule to add two components (LoanNO, DateSent) as part of the primary key of the Sent table.
Student(StdNO Primary Key, StdName, StdAddress, StdCity, StdState, StdZip, StdEmail)
Loan(LoanNO Primary Key, ProcDate, DisbMethod, DisbBank, DateAuth, NoteValue, Subsidized, Rate)
Foreign Key (StdNO) References Student(StdNO)
Foreign Key(InstID) References Institution(InstID)
Foreign Key(LenderNO) References Lender(LenderNO)
StdNO Not Null
InstID Not Null
LenderNO Not Null
Institution(InstID Primary Key, InstName, InstMascot)
Lender(LenderNO Primary Key, LendName)
DisburseLine(DateSent, Amount, OrigFee, GuarFee)
Sent (LoanNO, DateSent)
Foreign Key(LoanNO) References Loan(LoanNO)
Foreign Key(DateSent) References DisburseLine(DateSent)
LoanNO Not Null
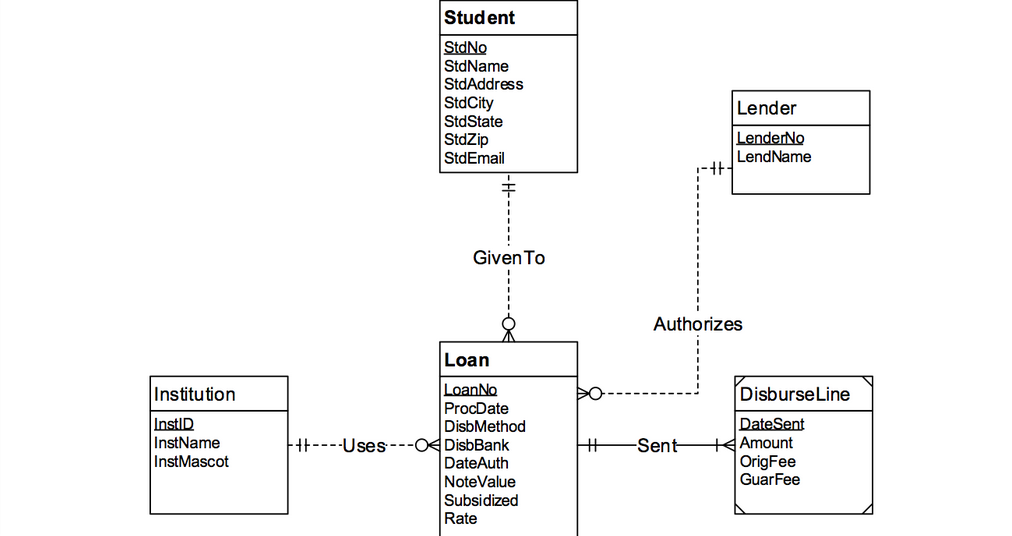
When building a schema for a relational database, opt for keeping data to the granular level. It is imperative that an ERD (Entity Relationship Diagram) is created to visualize objects(tables) within an organization or information system and their relationships to one another. Say you have a “Customer” table, this table should have all the attributes that would be needed for creating reports at the business analyst level that would support strategic decisions. Or maybe you have an “Payments” table, this table should include attributes like debits, credits to support cleaner and simpler data extraction via SQL.
See sample Entity Relationship Diagram I created below:

“Yield higher buyer satisfaction by developing products that actually solves a problem, is easy to use/set up, is convenient, fun and environmentally friendly.”

The new tax law will offer tax cuts to businesses which raises many questions among leaders as to how to best utilize that capital/ tax savings. Many companies have decided to invest in their people by giving away generous bonuses which embodies the employee-centric philosophy. In addition, to demonstrating your appreciation for your employees you also may find the following tips useful.
I hope you’ve enjoyed these tips!
As always, “Success is continuous improvement!”

By understanding customer priorities you yield profitable insights. When you plan your data analysis around your strategic goals and customer priorities you reduce waste and enhance productivity. Below I have developed a relative logistics SQL database schema to demonstrate my skills. (SQLlite Source)
CREATE TABLE customers (
cust_id INTEGER PRIMARY KEY,
cname TEXT,
DATE NONE NOT NULL,
invoice INTEGER,
balance NUMERIC
);
INSERT INTO customers VALUES (1, “BBC Co”, ’07-03-2014′, 1004, 10000);
INSERT INTO customers VALUES (2, “ZTA”, ’08-11-2014′, 1005, 25000);
INSERT INTO customers VALUES (3, “ABY”, ’06-22-2017′, 1006, 35000);
INSERT INTO customers VALUES (4, “HIP”, ’03-27-2016′, 1007, 0);
INSERT INTO customers VALUES (5, “TIME”,’09-14-2015′, 1008, 900);
INSERT INTO customers VALUES (6, “SWE”,’02-17-2017′, 1009, 18000);
INSERT INTO customers VALUES (7, “SVW”,’04-30-2017′, 1010, 50000);
SELECT * from customers;
SELECT *
from customers
WHERE balance >=
(Select MAX(balance) from customers where balance != 0
and date < ’04-30-2017′);
SELECT cname, invoice, balance from customers WHERE balance > 10000 and invoice != 1005;
CREATE TABLE loads (id INTEGER PRIMARY KEY, city TEXT, fuel_fixed NUMERIC, weight NUMERIC);
INSERT INTO loads VALUES (1, “LA”, 500, 1000);
INSERT INTO loads VALUES (2, “Omaha”, 700, 3500);
INSERT INTO loads VALUES (3, “Dayton”, 1400, 5500);
INSERT INTO loads VALUES (4, “Denver”, 2500, 4100);
INSERT INTO loads VALUES (5, “Paris”, 100, 1000);
INSERT INTO loads VALUES (6, “Ridgewood”, 700, 1500);
INSERT INTO loads VALUES (7, “Rochelle”, 747, 1500);
SELECT * from loads;
SELECT * from customers
JOIN loads ON loads.id = customers.cust_id
WHERE balance > 0;
SELECT cname, city, balance, weight from customers
JOIN loads ON loads.id = customers.cust_id
WHERE city != “Denver”;
Happy Holidays!
I hope you have a great, delicious and safe holiday!


Profitability and optimized performance pressure from top management are driving CFOs and Finance executives to develop and maintain effective financial planning and analysis skills. It also means going beyond the numbers by bringing the voice of the customer into the spectrum.
To deliver exemplary financial planning and analysis results, you must have clear understanding of the current business financial and conduct (customer and employee perceptions) standing, compare critical KPI metrics to competitors, analyze the industry to identify value factors and trends that can yield profitability and differentiate your company from competitors coupled with the optimization of client satisfaction, and utilizing the most effective budget model for your business.
For example, your business may use a historical budget model coupled with variance analysis, trends analysis and CRM deals tracking (revenue forecasting). However, for more efficient results, you should also analyze risks (create and maintain an annual risk management plan), make savings as an expense (automate savings for your business), collaborate with HR to assess and properly plan for hires, include an emergency reserve budget for unexpected expenses in your budget, and ensure you have a strong inventory management process.
The 3 most important KPIs in finance are: costs, staff productivity and process efficiency. These should be compared to industry and competitors to realize opportunities for improvement. It is also important to be aware of the costs associated with the staff that handles financial planning, budgeting and forecasting. Some measures of performance that should be tracked to assess costs should be cost per invoice, process cycle time, average receivable days (DSO), lead time, percentage cost to perform the function process as a percentage of total finance process cost, et cetera. These measures of performance should also be benchmarked.
Top management must lead the change in the finance department if they seek to yield optimized productivity and profitability. Effective leaders “walk the talk.” They communicate the changes in strategy and company mission daily to employees and encourage critical KPIs to be visual and periodically reported.
