Professional Business Services: Business Process Improvement, Bookkeeping, IT Solutions, Human Resources, Payroll, Wordpress.com Website, Data Analysis, and Management Consulting
Are you tired of wasting valuable time and resources on inefficient processes? Do you want to learn how to streamline your workflow and increase productivity? Look no further than my new process improvement book!
The journey to building successful business processes begins with understanding their essence. A process is a sequence of steps that transform inputs into valuable outputs. To emulate industry giants like Apple, Google, and Amazon, renowned for their competitiveness, you need to employ Lean Six Sigma tools and techniques. In this book, a certified Lean Six Sigma professional shares invaluable insights, complemented by their own research and experience, to help you design systems that analyze process performance in real-time, identify root causes of issues, and implement timely corrective actions.
The core principle of any business process is to create value and drive customer satisfaction by minimizing waste. Lean Six Sigma identifies seven sources of waste, including inventory, overproduction, and idle time. Through a step-by-step process improvement initiative, you will learn how to view processes in real time, collaborate with process owners, and leverage root cause analysis and gap analysis to eliminate inefficiencies.
Tracking and optimizing key performance measures are essential components of successful process design. This book delves into critical metrics like cycle time, value-creation time, and lead time. By mastering these measures, you can recognize automation opportunities, improve resource utilization, and ultimately enhance your bottom line.
To drive real change, top management must take the lead in fostering a culture of collaboration and open communication. This book emphasizes the importance of aligning business goals with process objectives, involving employees in process design, and embracing a customer-centric approach to management. By empowering employees with the right tools and knowledge, businesses can achieve high customer satisfaction and lasting success.
Competitive business processes are shaped by the insights of process owners, customers, and employees alike. By integrating their perspectives, businesses can create robust processes that bolster productivity and profitability. Learn how to harness customer input to improve perceived value and implement quality/contingency plans to handle potential process disruptions effectively.
If you’re determined to enhance your business’s performance or embark on designing competitive processes from scratch, “Workflows: How to Design, Improve, and Automate High Performance Processes” provides a comprehensive roadmap. Unlock the full potential of your business and create a winning edge in today’s dynamic marketplace. Don’t wait; start your journey towards success today!
See what a Phillips former top executive said about my book:
Are you tired of manually creating digital folders? Look no further! I have created a customizable Excel VBA Digital Folder Automation Code Template | Macros Digital Folder Code | Small Business Digital Folder Visual Basics Application that is easy to set up and run. This template is perfect for small business owners, data analysts, business analysts and more. I use this template myself at my 9 to 5 and have gotten significant raises for my VBA expertise. This template offers an easy way to set up path for folder, date format and folder name to easily automate digital folder creation process.
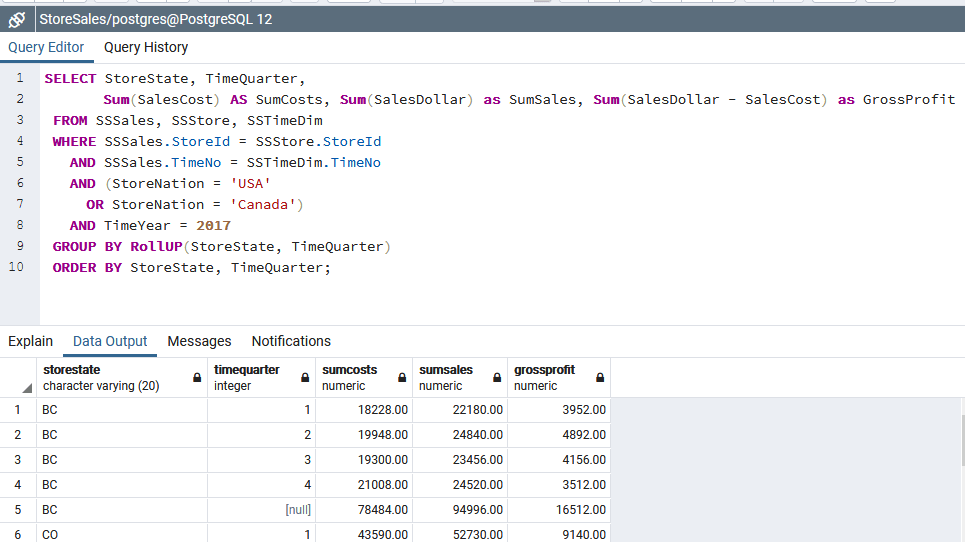
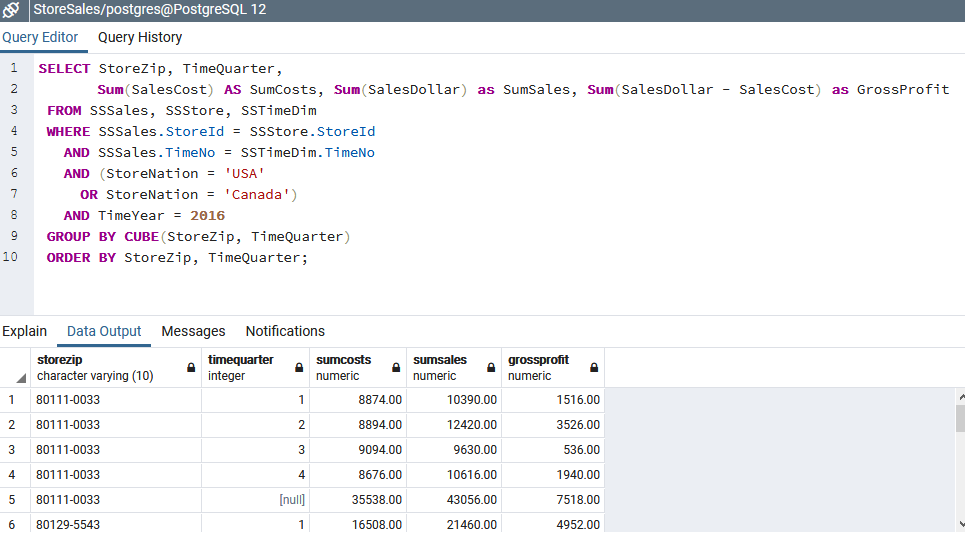
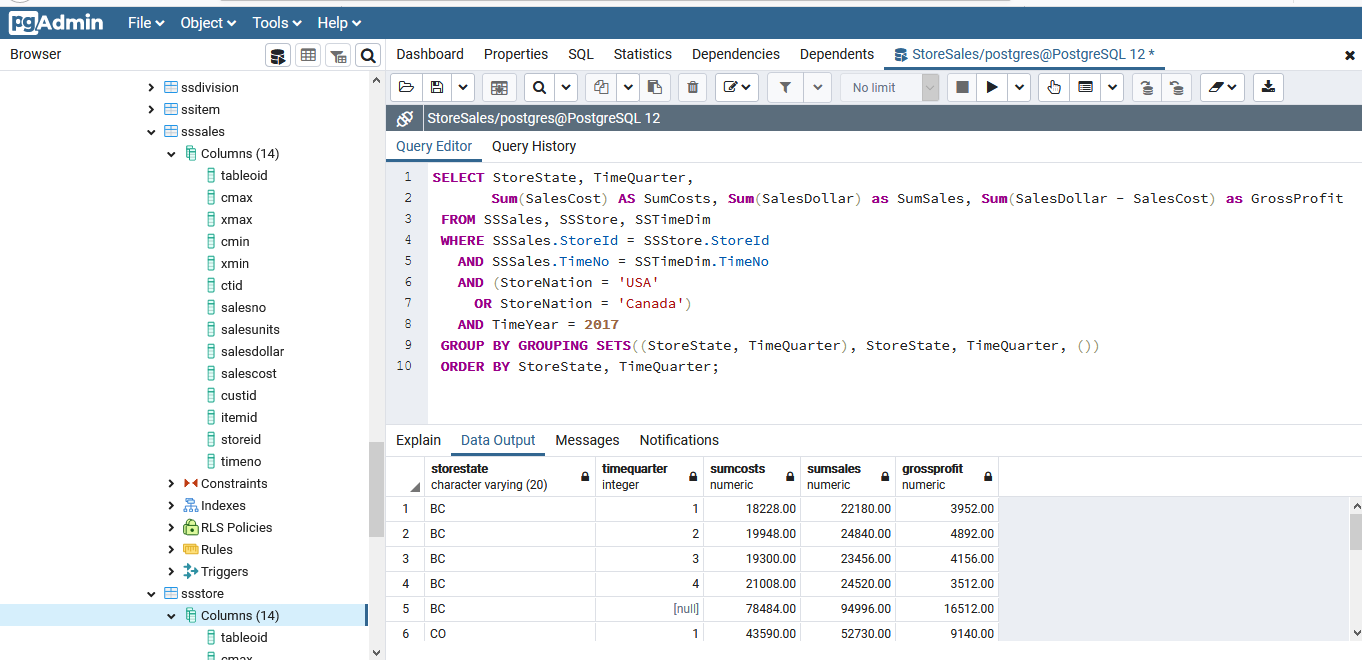
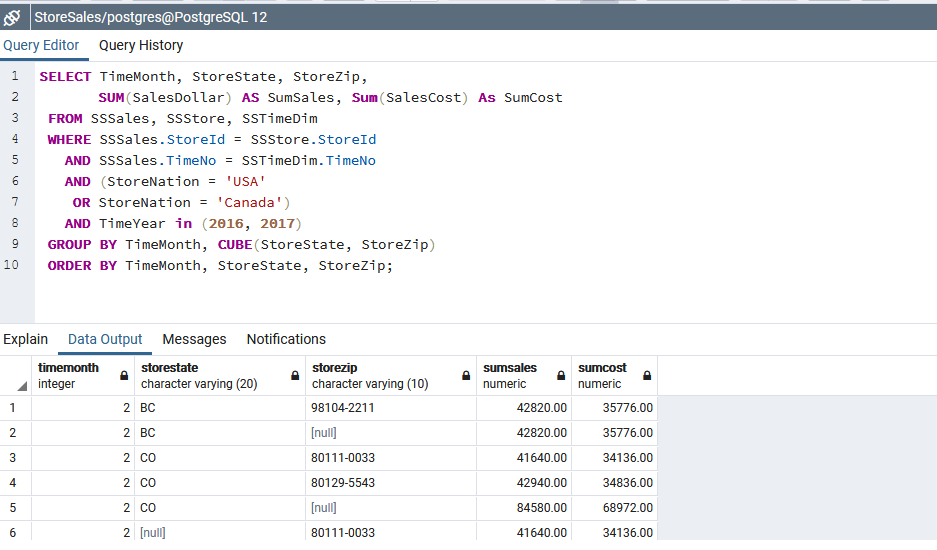
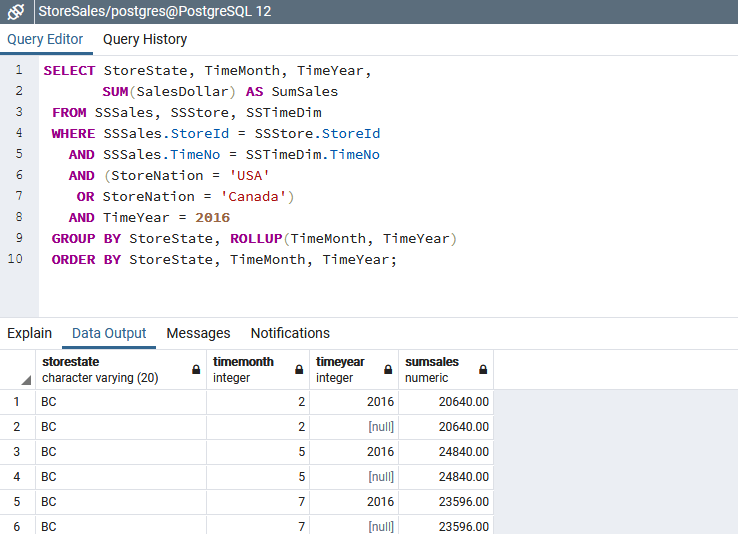
Continuing my SQL education, I have been working with PostgresSQL while taking online courses via Coursera. I have create some SQL statements using cube, rollup and grouping sets operators. See below:
It is common practice to determine your target customer when developing a business. However, this tunnel vision buyer group mentality leaves money on the table for businesses. To truly optimize profit and revenue a company’s leadership must be well aware of the many buyer groups (purchasers, actual users, and influencers) that can offer opportunity to enter into a new market space with high profit potential.
For example, say you are leather shoe manufacturer who usually focuses on retailers as its main buyer group. Through analysis of your current, similar and alternative products coupled with identifying the pain points of using your product you can realize a low-cost profitable opportunity to reel in your end users; essentially entering into a new market space.
A more effective strategic customer analysis would require you to understand the following:
Why buyers choose to buy your product; aka purchase criteria
What are the factors that cause customers to become angry with your product or company
What are the factors that keep potential customers at bay (you must understand their priorities and create solutions to meet their needs)
The preferences of your customers
The decision making process of your customers
Customer behavior
Why they choose to buy at a certain time (holidays, birthday, graduation, et cetera)
Time, travel, hassle and money the customer is willing to pay for buying and using your product or service
What functional needs need to be met
purchasing power
Businesses must also understand what factors motivate buyers to purchase based on price or quality. However, it is imperative that you just focus on the buyer group that has the highest profit potential at a lower cost and your company’s capabilities are able to meet their priorities.
In the high-stakes world of biotech and pharma, the challenges never stop. Tariffs disrupt global supply chains. Inflation erodes margins. Recessions tighten R&D budgets and pressure product pipelines. But for companies with a true moat those unique competitive advantages Warren Buffett prizes, these headwinds are opportunities to strengthen position, not retreat.
Pairing Buffett’s moat philosophy with the innovation frameworks from Blue Ocean Strategy and Blue Ocean Shift offers biotech and pharma leaders a path to not just survive turbulence, but to create uncontested market space and lock in resilience.
Step 1: Build a Resilient Moat Around Your Differentiators
In Buffett’s world, a moat protects a castle from invasion. In biotech and pharma, that moat can be:
Regulatory expertise in complex compliance environments.
Proprietary platforms like AI-driven drug discovery models or unique delivery mechanisms.
Exclusive supplier relationships that secure critical raw materials at stable prices. The deeper and wider the moat, the harder it is for competition or macroeconomic shocks to breach.
Step 2: Shift from Competing in Red Oceans to Creating Blue Oceans
Economic instability often drives companies to slash costs and fight harder in crowded markets. But this “red ocean” approach bleeds margins. Blue Ocean Strategy teaches us to make competition irrelevant by uncovering unmet needs and crafting new value propositions. In biotech/pharma, this might mean:
Developing low-cost, rapid-response diagnostic platforms for emerging health threats.
Partnering across industries (e.g., medtech + AI) to create hybrid solutions.
Repurposing existing molecules or manufacturing capacity for new, high-demand therapeutic areas.
Step 3: Hedge Against External Shocks With Strategic Flexibility
Inflation, tariffs, and recessions can’t be eliminated, but they can be absorbed with foresight:
Diversify supply chains across geographies to bypass trade barriers.
Use real-time market analytics to pivot to higher-margin segments when pricing pressures rise.
Monetize unused capacity or IP through licensing to smooth revenue dips.
Step 4: Lead the Shift With Data and Customer Insight
In Blue Ocean Shift, Kim emphasizes “humanness”, deep empathy with customers and stakeholders. For biotech and pharma, this means:
Using Voice of the Customer to guide pipeline priorities.
Involving clinicians, payers, and patients early to ensure new solutions have strong adoption and reimbursement potential.
Aligning launches to both unmet medical needs and evolving payer dynamics during economic downturns.
The Endgame: Endurance Through Innovation
Economic turbulence is a certainty. The companies that endure and even expand are those that:
Fortify their moat against direct competition.
Create blue oceans of uncontested market space.
Stay agile to navigate macroeconomic shocks.
Lead with customer-centered innovation to ensure adoption and loyalty.
In biotech and pharma, the moat isn’t just a defensive wall, it’s the foundation from which bold new markets are built.
In biotech and pharma, innovation often conjures images of billion-dollar R&D pipelines, sprawling labs, and years-long regulatory battles. But there’s another, often-overlooked path to profitable growth: maximizing the value of what you already have and letting the customer’s voice guide the way.
The High-Cost Trap
The average cost to develop a new drug can exceed $2 billion and take more than a decade. For many companies, especially mid-sized players, these economics put enormous pressure on margins. Leaders focus heavily on “what’s next” while overlooking untapped opportunities sitting inside their own data, processes, and customer relationships.
The Hidden Gold in Current Resources
Current resources, whether they’re existing data sets, underutilized equipment, established distribution channels, or prior trial results can often be repurposed to create new revenue streams at a fraction of the cost of traditional development. Examples include:
Repurposing molecules for new indications using existing safety data
Leveraging unused lab capacity for contract research services
Reanalyzing past trial data with modern analytics to uncover missed opportunities
Using established supply networks to enter adjacent therapeutic areas
The key is recognizing these assets, quantifying their value, and aligning them to real market needs.
Voice of the Customer: The Compass for Low-Cost Innovation
Too often, biotech and pharma rely solely on internal scientific priorities when shaping pipelines. While science is the foundation, the Voice of the Customer (VoC) is from physicians, patients, payers, and regulators, provides a clear map of what will actually succeed commercially.
Listening to the customer can reveal:
Under-served patient populations
Frustrations with current treatments that competitors overlook
Desired delivery methods or formulations that can be developed with minimal R&D investment
Service gaps in clinical trial support or patient on-boarding that competitors ignore
By blending VoC insights with your existing resources, you create a low-risk, high-return opportunity pipeline.
My Approach: Data, Lean Thinking, and Cross-Functional Execution
Over my 11+ years in analytics, process improvement, and business analysis, I’ve helped organizations turn overlooked assets into measurable results:
40% faster reporting cycles by streamlining existing data pipelines—no new software costs
$2M+ in cost savings by reengineering processes using Lean Six Sigma
$1.4M in recovered receivables by reanalyzing existing customer credit data
Built customer-driven dashboards that informed product strategy without expensive market research firms
In biotech/pharma, this means integrating operational data, clinical insights, and customer feedback to prioritize initiatives that can be launched quickly and profitably.
The Bottom Line
Not every growth opportunity requires a moonshot drug discovery project. Sometimes, the fastest path to revenue lies in the assets and insights you already own combined with a disciplined approach to listening to your market.
When you align existing resources with the Voice of the Customer, you don’t just save money, you accelerate innovation where it matters most.
In today’s biotech and pharmaceutical sectors where innovation meets regulation, and R&D meets risk, operational excellence is no longer just a competitive edge. It’s the lifeline of sustainable growth.
I’m an Operational Efficiency Expert with 11+ years accelerating transformation through Lean Six Sigma, advanced analytics, and cross-functional leadership. I’ve driven outcomes like over $2M in cost savings, 40% faster billing/reporting cycles, 85% adoption of new systems, and over 60% productivity improvement. Here’s how these capabilities can power solutions to core industry pain points:
1. Accelerate Time-to-Market & Lower R&D Overhead
Pain: Lengthy, costly drug development cycles. Solution: Apply Lean Six Sigma to R&D workflows, streamlining clinical trial protocols, mapping bottlenecks, and eliminating waste. Combine this with predictive analytics (Python/R) to model trial outcomes earlier, freeing capital and accelerating approvals.
2. Reduce Regulatory Delays
Pain: Overburdened regulators and shifting compliance. Solution: Standardize data collection and dashboards to align with audit-ready formats. Conduct small-scale simulations through kaizen projects to embed regulatory compliance into operational DNA, boosting preparedness and reducing approval delays.
3. Fortify Against the Patent Cliff
Pain: Revenue risks as patents expire. Solution: Leverage market and financial analyses to prioritize in-licensing or M&A targets balanced with internal innovation. Design dashboards to track drug exclusivity horizons, forecast shortfalls, and guide strategic investment—much like your pricing transparency strategies for SaaS.
4. Make Supply Chains Resilient
Pain: Disruptions risk critical shortages. Solution: Use data warehousing (SQL, BI tools) to monitor supplier risk and build dashboard triggers when vulnerability thresholds are hit. Simulate backup supplier scenarios through modeling, mirroring findings that redundancy can dramatically minimize shortage risk.
5. Drive Digital Adoption (AI, Pharma 4.0)
Pain: Digital twins and AI tools underused due to poor change management. Solution: Implement human-centered design and change strategies (Kotter’s model, kaizen training) to foster operator trust and usability. Standardize dashboards for real-time monitoring and staff coaching, drawing on your high adoption rates and cross-team change governance success.
6. Build Digital Talent & Workforce Resilience
Pain: STEM/digital workforce gaps. Solution: Establish up-skilling programs rotation, data literacy, analytics tools training. Build career paths anchored in continuous improvement and leadership, mirroring strategies like strategic workforce embedded in operations.
7. Streamline Clinical Trial Operations
Pain: Complex trials and recruitment delays. Solution: Optimize trial startup processes through process mapping and automation, employing dashboards to monitor recruitment and retention KPIs. Use clustering analytics to segment patient populations and improve outreach strategies, enabling faster and more predictable trial flows.
Closing: The Value Proposition for Biotech & Pharma
In the face of R&D expense, regulatory turbulence, patent expires, and supply fragility, operational strategy is not just support—it’s survival. Modern data tools, rooted in Lean principles and driven through human-centric leadership, can unlock agility, visibility, and profitable innovation.
I’ve helped organizations shift from static reporting to dynamic, results-oriented operations. Let’s re-imagine how biotech and pharma can deliver breakthroughs—faster, smarter, and with built-in resilience.
Biotech and pharma companies face existential challenges—from patent cliffs to regulatory friction. With deep experience in Lean, analytics, BI, and change adoption, I enable strategic operational transformation that accelerates innovation, reduces risk, and builds future-ready resilience.
In today’s hyper-competitive payments landscape from global giants like Fiserv and Adyen to agile BNPL innovators like Affirm, merchant performance is often held back by operational inefficiencies, integration silos, and legacy constraints.
As an Operational Efficiency Expert with 11+ years transforming cross-functional operations, reducing costs by millions, and embedding analytic rigor and Lean Six Sigma into enterprise workflows, here’s how I see these pain points—and how to solve them.
1. Transparent, Lean Cost Structures
Challenge: Opaque pricing frustrates merchants and erodes trust. Solution: Lead a Lean Six Sigma initiative to streamline pricing disclosures—map current fee flows, eliminate redundancies, and implement value-stream oriented pricing tiers. Impact: Simplifies merchant decisions, reduces support calls, and enhances satisfaction—driven by both data insights (Python/R) and human-centered kaizen workshops.
2. Frictionless Integration & Onboarding
Challenge: Merchant onboarding (especially with merchant account models) is slow and error-prone. Solution: Apply process mapping and automation (e.g., RPA, Salesforce integration) to reduce onboarding cycle time—similar to how you cut billing cycles 40% and reduced reporting time by 40% at SunteckTTS. Impact: Faster merchant activation, improved data accuracy (<1% error), and scalable, self-service models using dashboards and user analytics.
3. Scalable Customization for Diverse Merchant Needs
Challenge: SMB-oriented platforms (e.g., Square) lack enterprise-grade flexibility. Solution: Leverage analytics segmentation to tailor modular packages—tiered pricing, API access, POS bundles—balanced using customer clustering and feedback loops. Impact: Supports growth across merchant segments while keeping operations lean via configurable offerings.
4. Modernize Legacy Infrastructure with Agile Data Platforms
Challenge: Large processors struggle with legacy systems and slow data flow. Solution: Drive a Data Warehouse + BI platform integration (e.g., AWS + Tableau/PowerBI + SQL) to reduce reporting lag and enable real-time KPI dashboards—mirroring your success at SunteckTTS. Impact: Enables proactive issue detection, improves decision velocity, and supports global teams consistently.
5. Risk and Fraud with Reliable Change Governance
Challenge: Fraud systems are critical—but merchants resist change due to disruptions. Solution: Implement change-management frameworks (Kotter, Kaizen) to roll out antifraud tools (e.g., AI-driven detection) coupled with adoption metrics dashboards—much like your 85%+ technology adoption rate. Impact: High adoption of fraud controls, low system downtime, improved uptime reputation akin to “plumbing” reliability seen at Elavon The Times.
6. Consumer-Centric BNPL without Hidden Risks
Challenge: BNPL models risk consumer overextension; fee disclosures (like in BNPL food delivery) can backfire Business Insider. Solution: Utilize predictive analytics and behavioral segmentation to set default thresholds and notifications—preventing overuse while maintaining transparency and choice. Impact: Reduced default, improved customer trust, and sustainable BNPL adoption.
7. Data-Driven Culture: From Reporting to Results
Challenge: Payment firms produce reports—but fail to convert them into action. Solution: Embed dashboards with embedded action recommendations (e.g., “billing delay rising—trigger root-cause analysis”) using Tableau/PowerBI, backed by SQL/ML alerts—similar to your proactive FP&A and analytics work. Impact: Moves firm-wide culture from passive reporting to operational agility, boosting ROI and manager confidence.
Closing Note & Call to Action
As payment technology converges with operational complexity, only those companies that streamline processes, modernize data infrastructure, and human-center change will lead.
If your organization is looking to scale payment operations with measurable improvements in cycle time, cost, adoption, and predictive insight, I bring the expertise—from Lean Six Sigma to data analytics—to deliver results. Let’s turn performance pain points into transformational opportunity.
In the highly regulated, innovation-driven biotech and pharmaceutical industries, process improvement isn’t just a cost-saving measure — it’s a strategic lever for accelerating product development, ensuring regulatory compliance, and maintaining patient safety. The stakes are high: a single inefficiency can delay critical therapies, inflate R&D costs, or compromise quality.
Drawing from Lean Six Sigma, data analytics, and cross-functional collaboration, I’ve found that process improvement in life sciences requires a dual focus: streamlining operations without compromising compliance. Below are strategies and examples that can make a tangible impact.
1. Map the Value Stream to Uncover Bottlenecks
Value Stream Mapping (VSM) allows teams to visualize the end-to-end process — from discovery to commercial manufacturing — and pinpoint inefficiencies. In one instance, mapping a cell therapy development workflow revealed that 18% of total cycle time was lost during manual data handoffs between R&D and Quality Assurance. By automating data capture through an ELN (Electronic Lab Notebook) integration, we reduced cycle time by 12% and improved traceability for FDA inspections.
2. Embed Real-Time Analytics for Decision-Making
Pharma operations generate massive datasets — from stability studies to batch records. Leveraging Power BI dashboards or Python-based statistical process control can turn that data into actionable insights. For example, monitoring upstream bioreactor performance with real-time analytics allowed one team to detect deviations 48 hours earlier than before, preventing a potential $1.2M loss in API material.
3. Standardize Processes Without Stifling Innovation
While SOPs are essential for GxP compliance, over-standardization can slow early-stage R&D. A tiered SOP framework — where core compliance steps are fixed but exploratory workflows remain flexible — helps balance innovation with consistency. This approach shortened preclinical assay turnaround by 22% in a mid-size biotech I worked with, while still passing two consecutive FDA audits without observations.
4. Foster Cross-Functional Communication
Process improvement often fails not because of flawed methodology, but because of siloed communication. Biotech and pharma projects span R&D, QA/QC, Regulatory Affairs, and Manufacturing — and each function speaks its own “language.” Embedding a process liaison role in project teams, equipped with both scientific literacy and Lean Six Sigma skills, can accelerate problem-solving. In one case, this cut tech transfer documentation errors by 40%, saving weeks in scale-up.
5. Build a Culture of Continuous Improvement
Kaizen events and small-win projects may seem modest, but they create momentum. When scientists and engineers see their feedback translate into tangible changes — such as reducing a chromatography column packing step by 30 minutes — they are more likely to engage in future initiatives. In biotech, where innovation is the currency, this culture shift ensures that process improvement is seen as an enabler, not a constraint.
The Bottom Line
In biotech and pharma, process improvement is not just about efficiency — it’s about speeding patient access to life-changing therapies while safeguarding quality and compliance. By combining data-driven decision-making, lean methodologies, and collaborative leadership, organizations can turn process improvement into a strategic differentiator.
A Data-Driven Approach to Patient and Payer Risk Scoring
Medical billing involves millions of dollars in claims and reimbursements. Identifying which patients or insurance providers are likely to delay or underpay can improve cash flow, reduce bad debt, and streamline the revenue cycle. In this post, I’ll walk you through how I built a predictive credit risk model using R, tailored to the medical billing industry. *AI was used to create dummy records.*
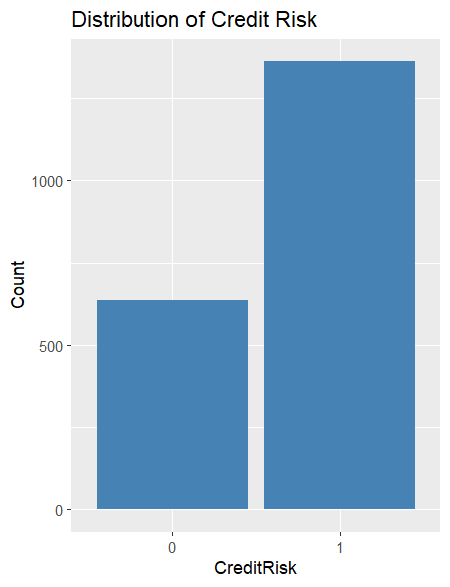
Project Objective
The goal was to build a machine learning model that predicts the likelihood of credit risk — defined as underpayment or payment delay — based on patient and billing data.
Why this matters:
Prevent revenue leakage
Flag high-risk claims early
Focus collection efforts where they matter most”
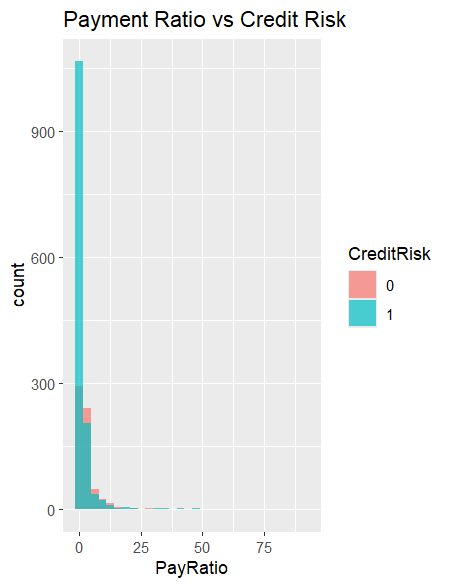
What is Credit Risk in Medical Billing?
In the context of healthcare billing, credit risk refers to:
A patient or payer paying less than 80% of the total billed amount
Taking more than 60 days to pay
This model helps billing departments assess which claims are at higher risk for non-collection or delay and take proactive steps.
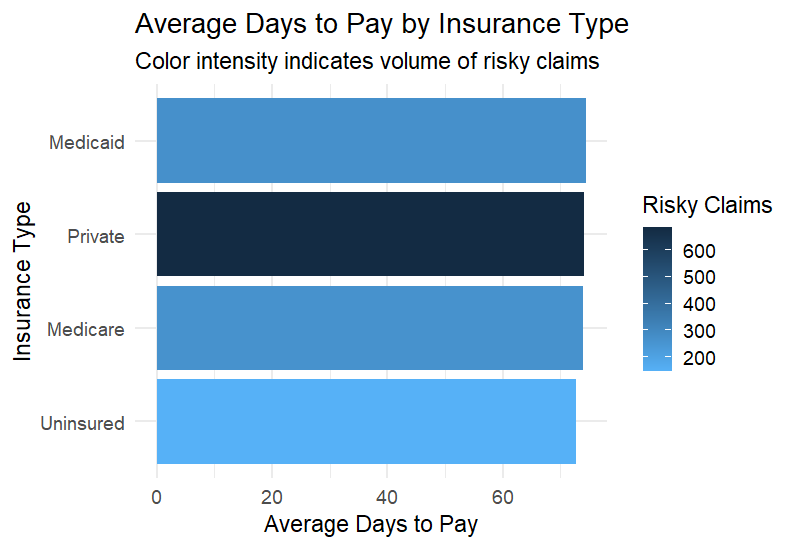
Dataset Overview
To simulate a real-world scenario, I generated 2,000 records of dummy medical billing data with the following variables:
Age
Gender
Insurance Type (Private, Medicare, Medicaid, Uninsured)
In the world of biotech, predicting clinical trial outcomes can drive massive strategic and financial value. Using a dataset of 200 simulated clinical trials, this case study demonstrates how advanced analytics in R—particularly Random Forest modeling—can forecast success with 85% accuracy.
💡 Business Impact Highlights:
$2.6B in potential cost savings
30% reduction in late-stage failures
Improved investor confidence
Smarter portfolio optimization
📁 Dataset Overview
The Clinical Trial dataset was created with R and structured to reflect real-world diversity in trial design and outcomes:
We used R to preprocess the data, engineer features, and implement a Random Forest classifier with 500 estimators.
Key Steps:
Factorized categorical variables
80/20 train-test split
Random seed for reproducibility
ROC & cross-validation for validation
🧠 Top Predictive Features
The model revealed that the most influential predictors of trial success are:
Trial Duration
Previous Failures
Molecular Type
Trial Phase
Half-life
🔎 Notable Findings:
Phase III trials have 45% higher success than Phase I
Small molecules outperform biologics by 25%
Trial duration matters: 620 days (success) vs. 520 days (failures)
Each previous failure drops success probability by 15%
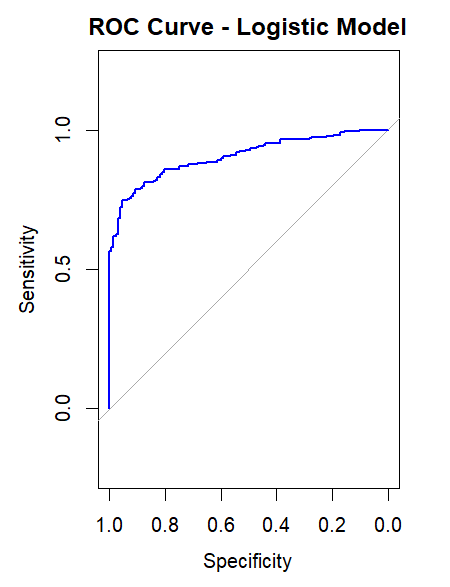
📊 Model Performance
📈 ROC Curve
Metric
Value
Accuracy
85%
AUC Score
0.82
Precision
78%
CV Accuracy
83% ± 4%
Confusion Matrix:
TP: 22 | TN: 12 | FP: 4 | FN: 2
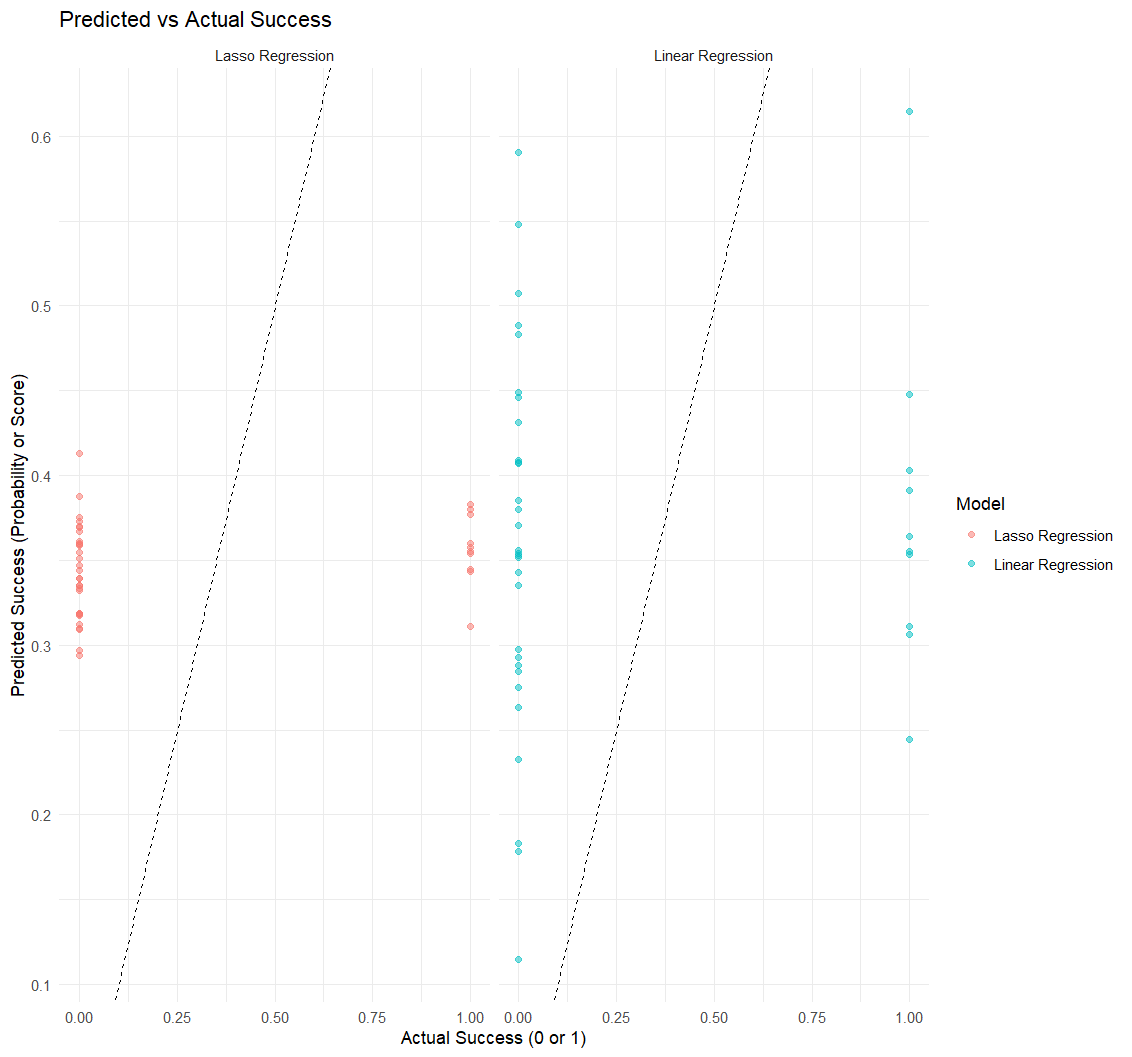
📉 Predicted vs Actual Success Rates
Using Linear & Lasso Regression, we verified the predictive strength and consistency across models. The Random Forest model outperformed others in accuracy and generalization.
💼 Business Applications
✅ Use Cases:
Portfolio Optimization: Rank candidates by predicted success
Go/No-Go Decisions: Data-backed phase transitions
Investor Relations: Reinforce strategic claims with metrics
Risk Mitigation: Detect high-risk trials early
🧭 Recommendations
Immediate:
Deploy the model in planning
Automate alerts for high-risk designs
Set success probability thresholds
Enhancement Roadmap:
Integrate biomarker & patient data
Use ensemble or hybrid ML methods
Focus on small molecules and Phase III development
🧮 Impact Targets:
20% increase in success rates
$500M+ cost reduction
15% faster time to market
🚀 Future Enhancements
Timeframe
Action Items
0–6 months
Model deployment, stakeholder training
6–12 months
Add biomarkers, automate reporting
12+ months
Predict regulatory approvals, optimize trial design using AI
By combining domain-specific dummy data with advanced machine learning in R, this case study proves that predictive analytics can reshape clinical trial planning, reduce waste, and accelerate time to market. The $2.6 billion question is no longer “Can it be done?”—but “Why haven’t you done it yet?”
Abstract. In this paper on logistics firms’ revenue model, I will present comprehensive revenue strategies that will fortify business continuity during uncertain economic conditions like inflation and recession periods. With the current state of tariffs as of March 25, 2025, understanding how this will impact consumer behavior is key for optimizing revenue strategies and value propositions. The focus is on understanding the Voice of the Customer and industry trends to realize alternative revenue opportunities that will protect against economic volatility. Using RStudio and dummy data to develop advanced analytics and statistical visualizations to present data-driven insights supporting five key revenue strategies.
Executive Summary
During an era of economic volatility, logistics firms’ vulnerabilities to recession and inflation are heightened, which can cause significant erosion to revenue and diminish profit margins. In this paper, I will propose a multifaceted revenue strategy to build resilience and achieve revenue targets through proactive diversification:
Analytics-as-a-Service: Monetize logistics data via dashboards and predictive insights.
Tiered Pricing & Customer Segmentation: Roll-out tiered plans (Basic, Standard, Premium) aligned with customer value and willingness to pay.
Loyalty & Promotions: Implement rewards and bundled services to reduce churn and strengthen customer lifetime value.
Strategic Partnerships: Develop partnerships with tech providers, carriers, and fuel suppliers to unlock innovation and cost efficiencies.
Sustainability & Continuous Improvement: Focus on high-ROI green initiatives, optimizing operations and meeting growing demand for ESG accountability.
Through a comprehensive needs analysis, financial modeling, and data-driven tools including R-powered clustering, pricing simulations, and ROI matrices, this strategy equips logistics firms not only to survive economic downturns but also to seize growth opportunities. The findings presented in this paper will highlight that bundling analytics and loyalty programs, combined with strategic partnerships will yield the highest returns in both short- and long-term scenarios.
Industry & Economic Context
Currently within the logistics industry there is a sustained freight recession, driven by weakened global demand, oversupply of capacity, and depressed freight rates. Extensiv, “Transformative Logistics Strategies: Overcoming the Freight Recession” (2024), “The magnitude of the crisis facing the logistics industry cannot be overstated. With over 80,000 trucking companies and 8,000 brokers closing their operations, the sector is experiencing a contraction that mirrors the broader economic downturns of the past, yet with distinct characteristics unique to today’s global supply chain complexities. Notable examples such as the bankruptcy of Yellow Freight and the financial troubles of previously high-valued companies like Convoy highlight the vulnerability of the logistics sector to the current economic headwinds.”
Rising fuel prices, maintenance costs, and wage pressures have squeezed margins for logistics operators. Therein, rising layoffs in the transportation, warehousing, and manufacturing sectors are signaling a softening of labor markets, with unemployment edging toward 4.3% in May 2025. The current Tariff War and protectionist policies have disrupted global trade flows, increased costs, and induced inventory overstocking. Shippers are also facing higher tender rejections and spot rates, reflecting tightening conditions, yet structural uncertainties persist.
Surging need for fraud prevention and better data-driven insights has motivated firms to increase the adoption of predictive analytics, AI, automation, and digital freight platforms. Xeneta, “The Biggest Global Supply Chain Risks of 2025” (2025), “Digital twin technology has also emerged as a key driver of supply chain growth. According to McKinsey, the global market for digital twins will grow about 30 to 40 percent annually in the next few years, reaching $125 billion to $150 billion by 2032. Digital twins create a digital model of a physical product, system, or process, including its functionality, features, and behavior. In supply chains, they’re helping organizations model strategic changes made in response to emerging risks. By enabling teams to validate the impact of those changes, digital twins can help organizations invest in the right areas and make the decisions that deliver the best impact for their business, customers, and global supply chain operations.”
Consumer and stakeholder behavior shifts towards sustainability coupled with regulatory mandates are pressuring logistics providers to reduce emissions and transition to cleaner technologies (e.g., electrified fleets), especially in regions like California. ESG initiatives also offer cost-saving potential through route optimization and reduced fuel dependency.
Real World Case Studies
Since the depression era companies have found creative ways to strengthen their resilience during economic volatility. Logistic businesses are no stranger to creative strategies for ensuring business continuity during economic downturns.
Firstly, let’s consider FedEx. During the 2001 Recession, FedEx successfully shifted focus to capitalize on the e-commerce surge. To combat financial uncertainty, it focused on the following:
Developed partnerships with key retailers like Amazon and improved delivery flexibility
These initiatives allowed FedEx to sustain revenue growth, improve customer loyalty, and increase operational efficiency. Thus, demonstrating how pivoting to emerging market demands, and tech-led innovation can turn downturns into opportunities.
Secondly, we will consider UPS. Also, during a recession period in 2008, UPS strengthened its performance by embracing the following initiatives:
“Implementation of its ORION (On-Road Integrated Optimization and Navigation) system, which used advanced algorithms to optimize delivery routes.”
Operations Management: renegotiated contracts, consolidated shipments, minimized energy waste
These strategies allowed for multi-million-dollar savings that preserved margins through revenue dips and builds a preliminary case for the need for logistic firms to build strong alternative income sources as will be expanded on in the following needs analysis.
Needs Analysis
Background: The logistics industry’s sensitivity to macroeconomic conditions like recessions and inflation make it prone to financial instability. During these periods, customer demand may decline, fluctuations in cost (e.g., fuel, maintenance, labor), and reduced profit margins. Maintaining financial stability and growth during such periods will require developing alternative sources of income and strengthening value proposition.
Problem Statement: Logistic firm’s current revenue strategy is not resilient to economic downturns. It is imperative that proactive initiatives to safeguard income, attract and retain customers, and improve operational efficiency be implemented.
Objectives:
Develop multiple revenue streams resilient to economic downturns.
Increase customer retention and lifetime value.
Identify unique value propositions.
Optimize pricing strategies (e.g. 3-Level Pricing plus customer segmentation).
Utilize the Voice of the Customer through all strategic initiatives to ensure a positive impact on ROI and customer satisfaction.
Identified Needs:
Monetization of Data & Analytics (Revenue Strategy 1)
Need: Constant ad-hoc report requests from customers who want insights into logistics metrics (e.g. delivery times, route optimization, periodical spending)
Opportunity: Develop a paid analytics product or dashboard.
Impact: Serves as a new revenue source, deepens customer relationships and shows the firm as a strategic partner.
Need: Environmental responsibility has become critically important to customers and a growing number of organizations.
Opportunity: Launch sustainability initiatives that reduce waste, fuel usage, or optimize routes-that are based on a benefit-cost analysis for highest ROI.
Impact: Expands customer base by attracting sustainability-focused clients, reduces operational costs, and positions the firm as an authoritative and forward-thinking leader.
Stakeholders
Top Management (strategic decision-making, budget allocation)
Sales & Marketing Teams (customer engagement, tiered offerings)
Operations (Efficiency and Sustainability Initiatives agents)
A diverse revenue strategy is key for a logistic firm to weather economic downturns and uncertainties. By implementing a revenue strategy centered on customer value, efficiency, and innovation coupled with the five identified strategies which address specific needs and when implemented, provide a comprehensive approach to resilience and growth.
Detailed Revenue Strategy Roadmap
In effort to protect its business model from recession and inflation, the logistics firm will implement five interconnected revenue strategies. Each strategy is designed to improve financial resilience, drive customer value, and enhance operational adaptability. Provided below is the roadmap detailing the objectives, execution plan, required resources, KPIs, and ROI potential of each strategy.
Revenue Strategy 1: Analytics‑as‑a‑Service
Objective: Offer advanced analytics dashboards and insights to clients by monetizing internal logistics data, thus yielding optimized visibility and decision-making across their supply chains.
Bundle analytics with mid-tier and premium service packages.
Recommend custom analytics solutions for enterprise clients.
Tools & Resources:
Business intelligence platforms (e.g., Power BI, Tableau)
Data engineers and data scientists
API integration with client systems
KPIs:
Percentage of customers subscribing to analytics add-ons
Net new revenue from analytics services
Customer Satisfaction score for analytics services
Expected ROI: High, as the new revenue stream utilizes minimal variable costs once infrastructure is built. Enhance customer retention and upsell opportunities.
Objective: Roll-out a three-level pricing structure aligned to customer value, service intensity, and willingness to pay.
Execution Plan:
Clearly defined and value-added tiers: Basic (low-touch), Standard (balanced), Premium (white glove, analytics included).
Segment customers using historical spend, volume, and industry (via R clustering analysis).
Utilize random customer base sample (revenue, monthly load count) for Pilot pricing tiers; refine based on feedback.
Tools & Resources:
CRM and billing systems
Sales and marketing alignment
Customer segmentation model (built in R)
KPIs:
Revenue per user (ARPU) by tier
Tier conversation rate (Basic – Standard – Premium)
Customer churn per tier
Expected ROI: Moderate to High. This strategy secures more value from high-end clients while remaining competitive for price-sensitive ones while enhancing predictability of revenue.
Example Dummy Data Scenario Analysis
Utilizing dummy data and R, I created baseline data and strategy specific (tier pricing) visual below that demonstrates impact on revenue based on the implementation of tier pricing.
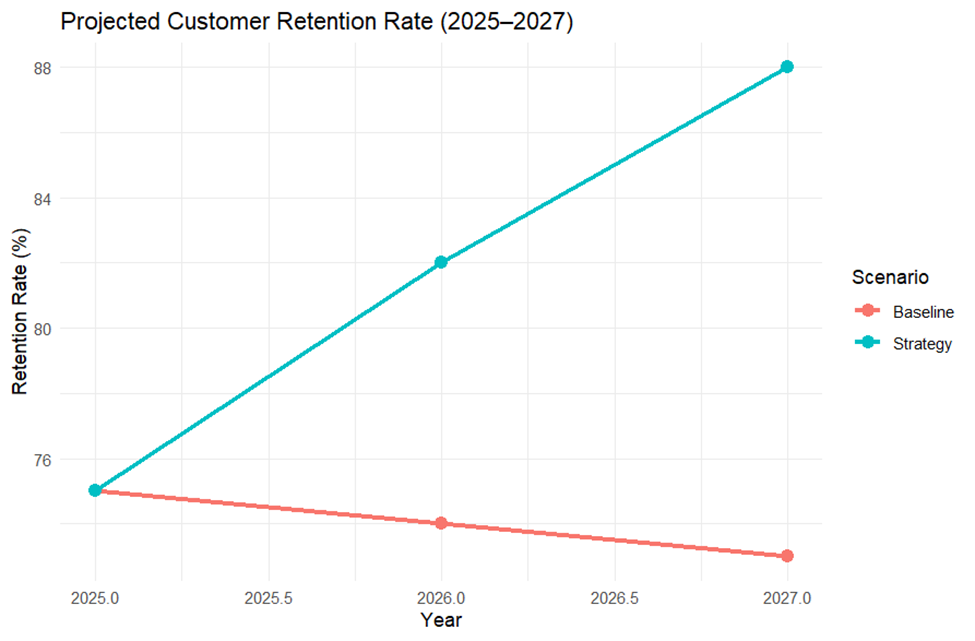
Revenue Strategy 3: Loyalty Programs & Promotions
Objective: Boost customer retention, reduce churn, and gain repeat business through targeted rewards, volume discounts, and seasonal promotions.
Execution Plan:
Establish a points-based loyalty program (e.g., discounts after a certain number of shipments).
Roll out promotional offers during peak off-season or to recover lost clients.
Tools & Resources:
CRM and marketing automation
Customer feedback systems
Predictive Churn modeling
KPIs:
Customer Retention Rate
Repeat purchase frequency
Program participation rate
Expected ROI: Moderate. Loyalty programs have costs but when executed properly they significantly reduce acquisition costs and increase customer lifetime value (CLV).
Revenue Strategy 4: Strategic Partnerships
Objective: Develop partnerships that reduce operating costs, expand service capabilities, or add complementary value to customers.
Execution Plan
Build partnerships with fuel providers for bulk rate savings
Collaborate with regional carriers to extend service reach at lower marginal cost.
Offer value-added services (e.g., insurance, packaging) via third-party partners.
Tools & Resources:
Business development team
Legal/contracts team
Shared tech infrastructure or APIs
KPIs:
Partnership benefit-cost savings
Revenue from joint offerings
% of customers utilizing partner services
Expected ROI: High. Internal costs are reduced and newly bundled services offered to clients. Broader differentiation created and customer stickiness.
Example Dummy Data: Strategic Partnerships Scenario Analysis
Objective: Use a benefit-cost framework to identify and implement high impact and operational efficiency initiatives.
Execution Plan:
Conduct a company-wide audit of resource waste, emissions, and process inefficiencies.
Utilize R to plot ROI vs. customer impact of various green initiatives.
Roll-out high ROI initiatives (e.g., electric fleet transition, route optimization AI, paperless billing).
Tools & Resources:
Process improvement consultants
ESG tracking tools
Lean Six Sigma methodology
KPIs:
Carbon footprint reduction per shipment
Process improvement cost savings per project
Customer perception of sustainability (via surveys)
Expected ROI: Depends on R-modeled ROI and brand enhancement. Key is to choose high ROI projects and build ESG credibility.
Dummy Data Example: Sustainability Scenario Analysis
Customer Segmentation
Successful customer segmentation empowers logistic firms to tailor pricing, promotions, and value-added services to specific customer needs, especially during periods of economic uncertainty. When equipped with comprehensive understanding of distinct buyer behaviors and priorities, the firm can optimize revenue and retention while deploying resources strategically.
Segmentation Methodology
I decided to use a K-means clustering analysis and dummy data in RStudio where customers can be segmented based on key variables such as:
Shipment volume and frequency
Revenue contribution
Industry type
Sensitivity to price changes
Adoption of digital/analytics services
Sustainability preferences
To demonstrate a practical implementation, I have defined four actionable customer segments below.
Cost-Sensitive Clients (“Budget Movers”)
Profile:
Small business/startup
Low shipment frequency
Extremely price sensitive, high churn risk during inflationary periods
Promotions: Frequency incentives, time-bound discounts
Analytics Offering: Minimal, free basic tracking dashboard offering as an incentive
Goal: Retention of these customers will be driven by competitive pricing and simplified offerings, while limiting service complexity and margin pressure.
High-Volume Clients (“Operational Anchors”)
Profile:
Mid-Large businesses
High shipment frequency, recurring bulk shipments
Value predictability, reliability, and performance metrics
Behaviors:
Inclined to pay more for guaranteed SLAs and integrated services
Receptible to long-term contracts and volume discounts
Strategic Approach:
Pricing Tier: Premium Tier with performance guarantees
Promotions: Volume-based discounts, loyalty perks
Analytics Offering: Complete service dashboard with KPI benchmarking, predictive ETA, and exception reporting
Goal: Augment lifetime value (LTV) through analytics upselling, loyalty programs, and strategic account management.
Sustainability-Focused Clients (“Green Partners”)
Profile:
ESG-driven businesses, often in retail, CPG, or healthcare
Mid-High volume, willing to pay more for carbon-neutral logistics
Behaviors:
Require emissions transparency and ESG compliance
Prefer vendors aligned with their sustainability goals
Strategic Approach:
Pricing Tier: Standard or Premium Tier with ESG service upsell
Promotions: Emission-reduction credits, recognition in annual ESG reports
Goal: Emphasize subscription-based analytics revenue, co-innovate with clients, and reduce churn through data stickiness.
Segment
Tier
Promotions
Analytics Offering
Budget Movers
Basic
Usage-based discounts
Basic tracking dashboard
Operational Anchors
Premium
Volume loyalty, SLA guarantees
Full KPI dashboard, route & delivery ETAs
Green Partners
Std/Prem
Carbon credit perks
Emissions dashboards, ESG reports
Data-Driven Operators
Premium
Custom integration packages
Real-time API, predictive analytics
SWOT Analysis
Strengths
Existing Customer Relationships: Strong foundation with customers already requesting analytics and insights
Operational Data Assets: Historical logistics data that can be monetized through analytics products
Industry Expertise: Comprehensive understanding of logistics operations, route optimization, and delivery metrics
Established Infrastructure: Existing operational systems and processes that can be leveraged for new revenue streams
Customer Trust: Proven reliability in logistics services provides credibility for expanded offerings
Stakeholder Alignment: Well organized structure with defined roles across management, operations, and technology teams
Weaknesses
Single Revenue Stream Dependency: Currently over-reliant on traditional logistics services
Economic Sensitivity: Highly vulnerable to macroeconomic fluctuations and downturns
Pricing Strategy Limitations: One-size-fits-all approach doesn’t optimize value capture across customer segments
Limited Diversification: Minimal alternative income sources to protect against industry volatility
Potential Resource Constraints: May lack internal specialized skills in analytics product development and tiered pricing implementation
Change Management Challenges: Organizational resistance to new business models and revenue strategies
Opportunities
Data Monetization Market: Growing demand for business intelligence and analytics across industries
Sustainability Trend: Increasing customer shifts towards environmental responsibility creates new value propositions
Technology Partnerships: Strategic alliances can enhance capabilities and reduce costs
Customer Segmentation: Untapped opportunities to serve different customer needs with tailored solutions
Loyalty Program Benefits: Opportunity to increase customer lifetime value and retention
Premium Service Offerings: Market willingness to pay for enhanced analytics and strategic insights
Threats
Economic Downturns: Recession and inflation directly impact customer demand and pricing power
Competitive Pressure: Imitation by other logistics firms as they may implement similar diversification strategies
Technology Disruption: Rapid changes in logistics technology could render current advantages obsolete
Customer Price Sensitivity: Economic pressures may lead customers to seek lower-cost alternatives
Regulatory Changes: Environmental and industry regulations could affect operational costs
Market Saturation: Driving competition in both traditional logistics and analytics services
3-Year Financial Impact Model
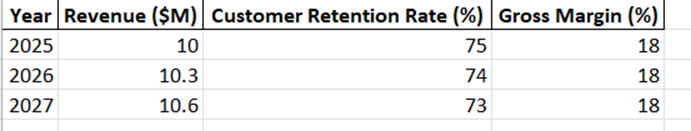
A dummy financial model was developed with the following data points that were used to create visualizations in RStudio:
Baseline Scenario
All Strategies Scenario
Taking account of the projections from the firm’s baseline and strategic scenarios, I then calculated the total gross profit over 3 years in both cases. Gross profit is achieved by multiplying annual revenue by gross margin percentage. The ROI is then computed using the following formula:
An estimated implementation cost of $1.5 million over three years was assumed, encompassing technology upgrades, training, promotional campaigns, and sustainability certifications.
Metric
Baseline Scenario
Strategy Scenario
Total Revenue (2025–2027)
$30.00M
$36.00M
Average Gross Margin (%)
26.67%
33.33%
Total Gross Profit
$8.00M
$12.00M
Implementation Cost
–
$1.50M
Net Additional Profit
–
$4.00M
ROI
–
166.67%
*Table is AI generated, and Figures have been rounded.
The analysis shows a 166.67% ROI with respect to the strategic investment, indicating a strong financial justification for pursuing the outlined initiatives. Over three years, the strategies are projected to generate $4 million in additional net profit beyond the implementation cost. This gain is steered by both revenue growth (from $30M to $36M) and margin expansion (from 26.67% to 33.33%), reflecting enriched pricing discipline, customer loyalty, and operational efficiency.
The ROI surpasses common corporate investment thresholds (typically 15–30%), suggesting that the firm is well-positioned to still thrive during economic downturns and potentially outperform competitors during periods of volatility.
Strategic Implications
Short-term: Instant benefits from pricing optimization and customer segmentation can yield improvements in cash flow and reduce churn.
Mid-term: Partnership and analytics initiatives may generate new service lines and minimize operational costs.
Long-term: Sustainability programs could enhance brand value and unlock premium segments focused on ESG compliance.
Investing in the proposed strategies is not only justified but highly favorable under conservative assumptions. Top logistics Executives should consider phasing in these initiatives with rigorous performance tracking to maximize returns while managing risk.
As prices soar and economic uncertainties loom, maintaining customer loyalty becomes a paramount concern for logistics businesses. In this article, we will delve into the strategies that can empower logistics companies to not only navigate the complexities of inflation but also foster and sustain customer loyalty.
Understanding the Impact of Inflation on Logistics
Inflation, the persistent increase in the general level of prices, has a cascading effect on the logistics industry. Rising costs of fuel, labor, and raw materials squeeze profit margins, leaving logistics businesses with the dual challenge of keeping their operations cost-effective while ensuring customer satisfaction. To address this, a multifaceted approach is essential.
Transparent Communication
One of the pillars of sustaining customer loyalty during inflation is transparent communication. In times of economic uncertainty, customers appreciate honesty. Logistics businesses should communicate proactively with their clients about the challenges posed by inflation and the steps they are taking to mitigate its impact.
This transparency helps build trust and demonstrates a commitment to a long-term relationship. Providing clear information about potential price adjustments, service modifications, and the reasons behind them helps customers understand the dynamics of the industry and fosters a sense of collaboration.
Cost Optimization without Compromising Quality
Inflation often necessitates a reevaluation of operational costs. However, cost-cutting measures should be implemented judiciously to avoid compromising the quality of service. Logistics companies can explore technology-driven solutions, process optimization, and efficiency enhancements to streamline operations.
Investing in state-of-the-art fleet management systems, route optimization software, and warehouse automation not only improves operational efficiency but also positions the company as a technologically advanced and customer-focused service provider. This commitment to innovation can be a key differentiator in the competitive logistics landscape.
Flexible Pricing Models
In times of inflation, rigid pricing models may lead to customer dissatisfaction. Logistics businesses should consider adopting flexible pricing models that align with the dynamic economic environment. Variable pricing based on fuel costs, market demand, and other economic indicators can provide both the company and its customers with a fair and adaptive structure.
Moreover, introducing loyalty programs, discounts, and promotional offers can help offset the impact of inflation on the customer’s end. This not only adds value for the customer but also encourages repeat business, enhancing overall loyalty.
Strategic Partnerships and Collaboration
Collaboration with suppliers, vendors, and other stakeholders in the supply chain can be a powerful strategy to mitigate the impact of inflation. Establishing strong partnerships allows for shared resources, collective problem-solving, and the negotiation of bulk discounts, ultimately leading to cost savings that can be passed on to the customer.
Furthermore, collaborating with customers to understand their evolving needs and challenges can lead to innovative solutions. Co-creation of value-added services or customized logistics solutions tailored to specific industries can enhance the perceived value of the logistics provider and strengthen customer relationships.
Embracing Sustainability
In the era of conscious consumerism, sustainability has become a significant factor in consumer choices. Logistics businesses can leverage this trend by integrating sustainable practices into their operations. While sustainability initiatives may require initial investments, they can lead to long-term cost savings, increased efficiency, and a positive brand image.
Investing in eco-friendly transportation methods, adopting green packaging solutions, and optimizing supply chain routes to minimize carbon footprint not only align with environmental values but also resonate with an increasingly environmentally conscious customer base. This alignment can contribute to enhanced customer loyalty and a competitive edge in the market.
Continuous Customer Education
In times of inflation, customer education becomes crucial. Logistics businesses should invest in educating their customers about the economic forces at play, the challenges faced by the industry, and the steps taken to mitigate these challenges. This proactive approach can help manage customer expectations and reduce dissatisfaction arising from unforeseen circumstances.
Regularly updating customers on industry trends, regulatory changes, and the company’s commitment to adapting to these changes creates a sense of partnership. This ongoing communication fosters a relationship beyond transactional interactions and builds a foundation of loyalty.
Invest in Customer Service Excellence
Exceptional customer service becomes a linchpin in sustaining loyalty during challenging economic times. Logistics companies should prioritize investing in customer service training, technology, and processes to ensure a seamless and positive customer experience.
Real-time tracking, responsive communication channels, and quick issue resolution are key elements of excellent customer service. Moreover, empowering customer service representatives to proactively address customer concerns and provide personalized solutions can significantly enhance the customer experience and strengthen loyalty.
Data-Driven Decision-Making
In the age of big data, leveraging analytics can be a game-changer for logistics businesses. Analyzing customer behavior, market trends, and operational data can provide valuable insights for strategic decision-making. By understanding customer preferences, logistics companies can tailor their services to meet specific needs and preferences.
Data-driven decision-making also enables predictive modeling, allowing logistics businesses to anticipate market fluctuations and inflationary trends. Proactively adjusting strategies based on these insights positions the company ahead of the curve and enhances its ability to navigate the challenges posed by inflation.
Conclusion
In conclusion, the impact of inflation on logistics businesses is undeniable, but with strategic planning and proactive measures, companies can not only weather the storm but also emerge stronger and more resilient. Transparent communication, cost optimization, flexible pricing models, strategic partnerships, sustainability initiatives, customer education, exceptional customer service, and data-driven decision-making collectively form a robust framework for sustaining customer loyalty during inflation.
By embracing these strategies, logistics businesses can navigate the challenges posed by inflation, build enduring relationships with their customers, and position themselves as industry leaders in a dynamic and competitive market. In the face of economic uncertainties, adaptability and customer-centric approaches will be the keys to success for logistics companies aiming to maintain and strengthen their customer loyalty.
Are you ready to embark on a worry-free and comfortable living journey? We present to you our meticulously crafted Rental Lease Agreement, a document that goes beyond the ordinary, ensuring a clear, transparent, and fair leasing arrangement for both landlords and tenants. Let’s delve into the features that make our agreement stand out, offering you peace of mind and a harmonious landlord-tenant relationship.
Parties and Dwelling Unit: Building Trust from Day One
In the realm of rental agreements, trust is the cornerstone. With our agreement, you’ll seamlessly enter into a trustworthy relationship, identifying [LANDLORD’S NAME] as the Landlord and [TENANT’S NAME] as the Tenant. The property details, whether it’s an apartment, unit, or house, are meticulously specified, including essential information such as the number of rooms and bathrooms. This ensures that both parties are not just on the same page but are walking hand-in-hand through the leasing process.
Length of Time (Term): Precision in Leasing
Define your leasing period with precision, from the initial term to the transition into a month-to-month arrangement. Our agreement emphasizes the importance of a 30-day notice from the tenant before vacating, fostering communication and cooperation. This feature ensures a smooth transition, promoting a cooperative relationship between landlords and tenants.
Rent: Clarity is Paramount
Clarity in rent details is paramount for a stress-free living experience. Our agreement provides a comprehensive outline of the monthly rent, late charges, and the repercussions of returned payments. This meticulous detailing ensures a smooth and fair financial understanding between both parties, eliminating any ambiguity that may lead to disputes.
Security Deposit: Fostering Transparency and Trust
In the realm of renting, transparency is key. Our agreement features a clear and fair security deposit clause, including conditions under which the deposit will be refunded to the tenant. This promotes a sense of trust, as both parties understand the terms and conditions, leading to a transparent and secure leasing arrangement.
Charges for Late Payments and Returned Checks: Cultivating Responsibility
Responsibility is the foundation of a healthy landlord-tenant relationship. Our agreement clearly defines charges for late payments and returned checks, fostering a culture of timely and responsible payments. This feature encourages tenants to adhere to the agreed-upon payment schedule, ensuring financial stability for both parties.
Keys and Locks: Prioritizing Security Measures
Security is a top priority in our agreement. We establish rules regarding keys and locks, ensuring that security measures are followed diligently. Tenants are reminded of their responsibility to return all keys at the end of the agreement, promoting a secure and well-managed living environment.
Damages: Fair Accountability for Repairs
Understanding and addressing damages is crucial. Our agreement clearly outlines responsibility for damages, ensuring fair accountability for repairs and rental payments during the repair period. This feature establishes a fair and transparent process for managing unforeseen circumstances, promoting a sense of security for both parties.
Maintenance: Prompt Communication and Cooperation
Maintenance is a shared responsibility. Our agreement details both landlord and tenant responsibilities for maintenance, emphasizing the importance of prompt communication and cooperation for repairs. This proactive approach ensures a well-maintained living space, enhancing the overall quality of living for tenants.
Restrictions/Alterations: Creating a Peaceful Living Environment
Clear guidelines are provided regarding the use of premises, alterations, and restrictions, ensuring a peaceful and respectful living environment for all parties involved. This feature sets the tone for harmonious coexistence, fostering a sense of community within the property.
Access by Landlord: Balancing Privacy and Necessity
Privacy is respected in our agreement. The document establishes reasonable terms for the landlord’s access, ensuring privacy and advance notice for the tenant. This feature strikes a balance between the landlord’s right to access for necessary reasons and the tenant’s need for privacy.
Discrimination Prohibited: Ensuring a Fair and Inclusive Environment
Our agreement strictly prohibits discrimination, promoting a fair and inclusive living environment. This feature reinforces the principles of equality, ensuring that all tenants are treated with respect and fairness, irrespective of their background or identity.
Change in Rental Agreement: Informed Decision-Making
Flexibility is key in our agreement. Provisions for changes in the agreement are outlined, ensuring both parties are informed and have the opportunity to accept or reject proposed changes. This feature promotes transparency and allows tenants to make informed decisions about their living arrangements.
Termination of Tenancy: Complying with Legal Requirements
Termination conditions are detailed, emphasizing compliance with state and local laws for a fair and legal termination process. This feature ensures that both landlords and tenants are aware of their rights and responsibilities, promoting a legally sound termination process when necessary.
Utilities and Service: Clarifying Responsibilities
Responsibilities for utility services are clarified, avoiding any confusion or disputes over service-related costs. This feature ensures that tenants are aware of their responsibilities regarding utility services, preventing potential disagreements and fostering a smooth living experience.
Contents of this Agreement: A Comprehensive Framework
The agreement is presented as a comprehensive document, encompassing all essential aspects of the leasing arrangement. Both parties acknowledge their understanding and acceptance of the terms, providing a solid framework for a transparent, fair, and harmonious living arrangement.
In conclusion, secure your rental experience with our meticulously crafted Rental Lease Agreement. This document is not just a formality; it’s a commitment to transparency, fairness, and a harmonious living environment. Elevate your living experience with a rental agreement designed to prioritize your peace of mind and comfort.