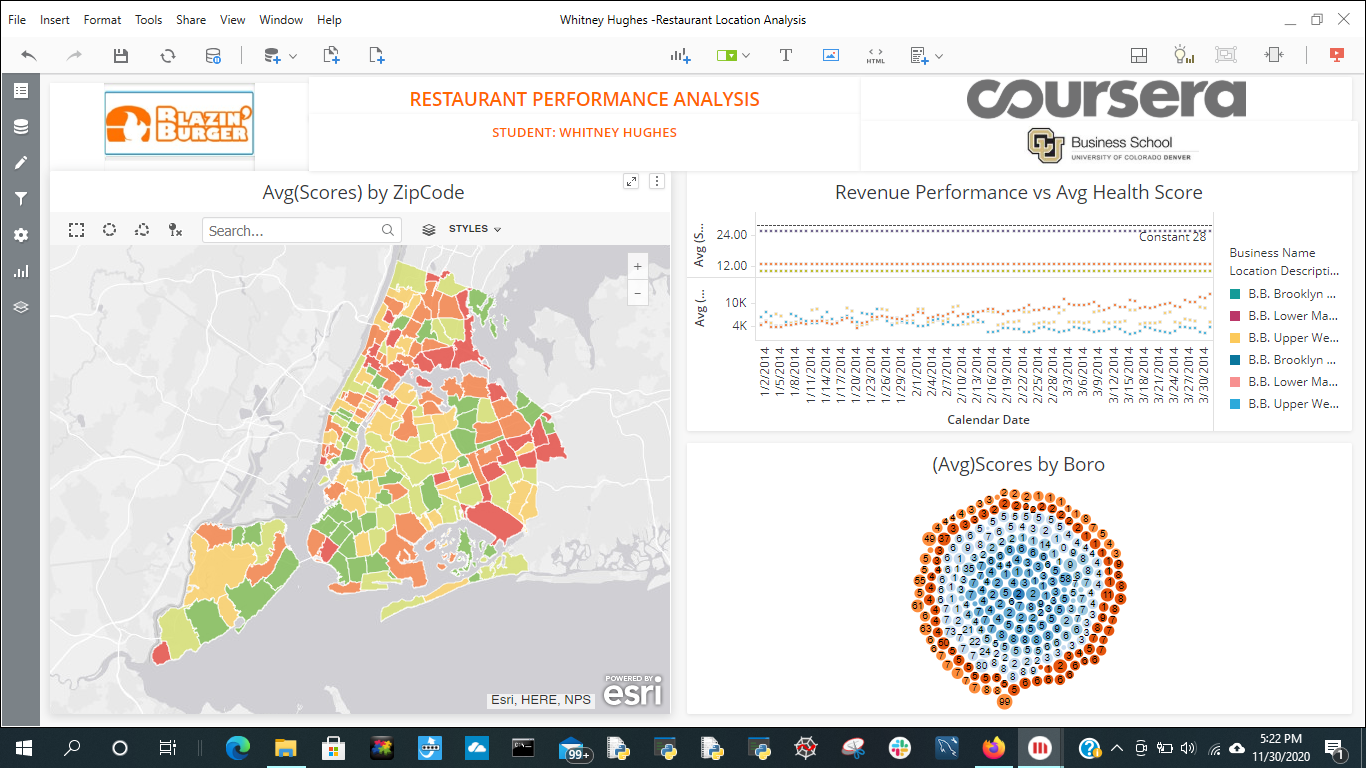
In this restaurant location analysis via Microstrategy I use 3D Bubble Charts, bubble and line charts, heat-map and map visualizations. I also link charts using the target visualizations functionality in Microstrategy.


Professional Business Services: Business Process Improvement, Bookkeeping, IT Solutions, Human Resources, Payroll, Wordpress.com Website, Data Analysis, and Management Consulting
In this restaurant location analysis via Microstrategy I use 3D Bubble Charts, bubble and line charts, heat-map and map visualizations. I also link charts using the target visualizations functionality in Microstrategy.
I am at the best when I use data and my expertise in process improvement to help individuals and small to large businesses reduce process costs, solve process/business problems, and improve efficiency, productivity and customer satisfaction. View more posts
